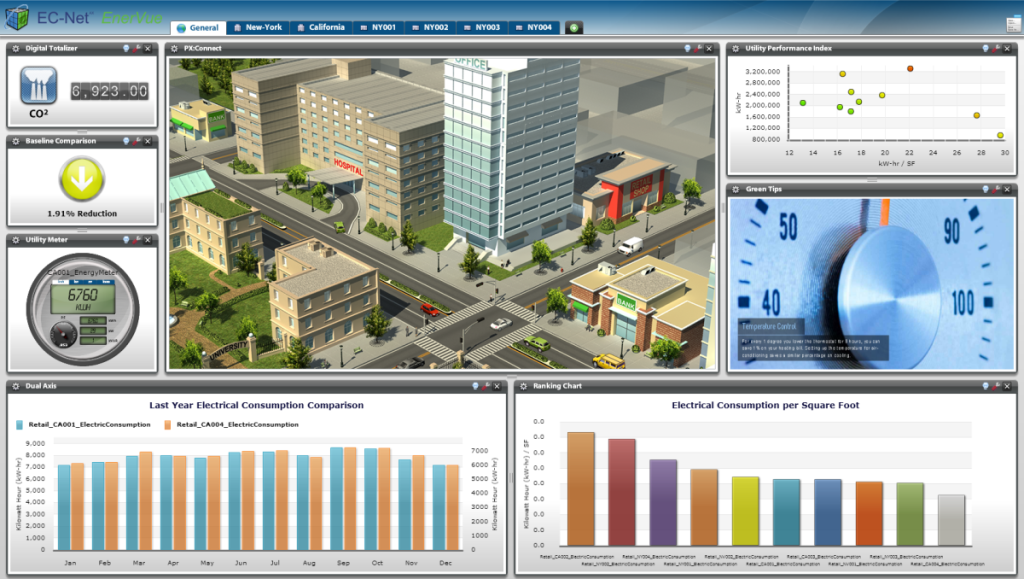
EC-Net AX Enervue Dashboard
EC-NetAX EnerVue is a graphics oriented Web-based energy management dashboard that provides proven visualization of vital building metrics through an easy-to-use, browser-based dashboard application. Suited for single or multi-site projects, EC-NetAX EnerVue allows users to quickly identify issues, assess relationships, and take action in order to optimize resource efficiencies and sustainability. Designed for a wide range of potential users, from system integrators to energy managers, facility managers and consulting engineers, EC-NetAX EnerVue can be fully customized and provide each user with their own unique dashboard client. The dashboard can easily be set up and modified using a library of viewlets.

Viewlets are available for various data, histories, and metrics, including energy trends, building comparisons, weather data, network status, consumption efficiencies, key performance indices, and more.
Track Key Performance Indicators (KPIs) at the corporate or individual site levels
Quickly detect issues and assess cost-effectiveness to take proper actions and optimize resource efficiencies
Makes use of, and converts into graphics and reports, real-time and historical data available in EC-NetAX
Rapidly identify historical trends as well as real-time facility and enterprise data, to facilitate business decisions
Easily identify energy and operational performance outliers with comparative analytics and performance dashboards
Runs as a service on an EC-NetAX station, residing either on EC-NetAX Supervisor or on an EC-BOSAX
Features
- User-Centric – Each user can create, view and modify their own dashboard “on-the-fly” in minutes, thus enabling them to focus on current or rapidly changing conditions for their area of responsibility
- Viewlet Export Options – Viewlets can be exported as an image file, or as an image within a PDF file. Their tabular data can also be exported in CSV format for instant use in reports and technical document
- Virtual Naming – Data mapped into EC-NetAX EnerVue can be given “friendly” (recognizable) names without impacting the underlying control database.
- Data Normalization – Provides the ability to normalize data such as energy consumption and account for differences in square footage, etc.
- Equivalency Conversions – Allows for “one-click” display of selected trends in equivalent units, such as kWh to dollars or metric tons of CO2.
- Kiosk Mode – Simplified display of normalized data by continuously cycling through the user’s viewlets. This display can foster awareness and support, while highlighting the energy initiatives of corporate and public sustainability awareness campaigns.
- Web-Based – Built with an open source framework for building and maintaining expressive web applications that deploy consistently on all major browsers, desktops, and operating systems
- Localization for Language and Currency – Dashboards can operate in multiple languages, even within the same installation, enabling multilingual, user-specific implementations
- Informational Screen Tips – Customizable screen tips enable the dashboard’s administrator to present EC-NetAX EnerVue end users with clarifying information, educational tips, or other relevant information prior to displaying a viewlet in kiosk mode.
- Auto Discovery Wizard – Allows users to efficiently identify and map the information from many sources, including meters, databases, or automation systems into multiple viewlets.
- Facility & Business Data – Provides integrated views of facility contribution to business profitability, such as energy cost per production unit.
- EC-Net AX EnerVue Guest Accounts – Guest accounts permit administrators to build views for a target audience, but prevent the guest users from accidently modifying the intended setup. This feature helps protect important configurations while “publishing” information to a large audience.
- EC-Net AX – Uses existing EC-NetAX user rights to enable maximum management flexibility.

